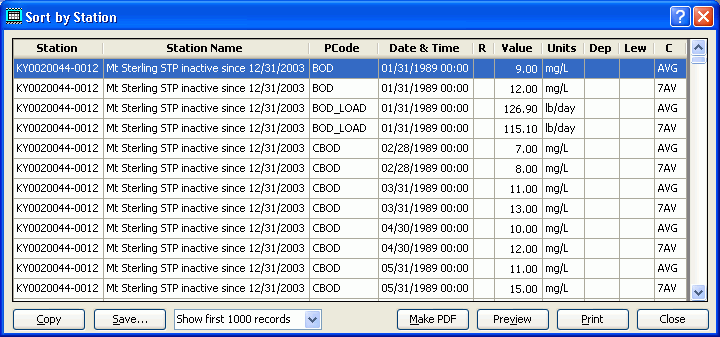
These reports print each individual record (observation) for the selected dataset sorted by various fields:

One of these reports (Date-time) is a "cross tabulation" in which data are placed in a grid such that all observations for a given date and time are placed on a row and the different parameters are placed in columns:

The report above is the "Sort by Date-time" report; all parameters in the dataset are placed in columns, sorted by PCode. Missing values for a given date are left blank. If there are more than one observations for a PCode at a given date and time, they are averaged and displayed.
Note that there are three Project Preferences that impact the appearance of this report:
Aggregate Times in Date-Time Report?: when set true, all reading on a given date in the report are combined (times are ignored)
RCodes in Date-Time Report?: when set true, RCodes are prepended to numeric results (e.g., non-detect values would look like "<0.01"); if false, only the numeric part of the value is shown
Highlight Empty Cells?: if true, cells containing no values are highlighted to make it easier to find missing values