In some situations you can save a lot of time by selecting Tools | Build Graphs. There are four ways to automatically build graphs:
Single Graph Tab: this will examine the first data table you have loaded and determine each Station ID/PCode pair. New series will be added for each pair, each on their own left Y axis.
Multi-tab by Station and PCode: this is the same as 1, except that each pair is plotted in its own tab. Existing tabs will not be affected.
Multi-tab by PCode: this is the same as 2, except that a new tab will be created for each PCode, each containing data from all applicable station.
Calibration Tabs & Layouts: this is a special purpose tool for building three graph tabs for each combination of Aggregate Station and Aggregate Parameter for a selected Calibration Dataset.
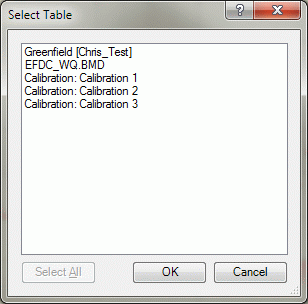
In all cases, you are prompted to select a table:
...and then the desired stations and parameters:
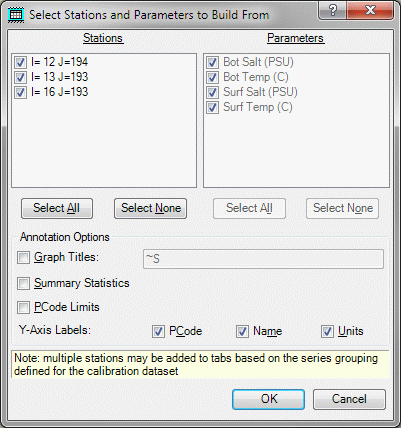
On this form, select all the stations and parameters from the table you just selected and one series will be added to one or more graph tabs (depending on which build type you initially selected) for each pair. To keep you from accidently selecting too many series, the number of combinations is computed and you are warned before the graphs are built.
If you selected a calibration dataset when prompted for the table and if that calibration dataset has groups defined, the note at the bottom of the form is displayed reminding you that multiple series may be plotted on a graph. In addition, the Parameters list is disabled because the group parameter filter will be used to select the parameters that will be plotted.
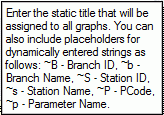
At the same time you are selecting stations and parameters, you are also given the opportunity to annotate all graph tabs to be created. This can be done independent of the build operation by selecting Tools | Annotate Graphs. Context-sensitive help for this field displays this information:
Normally, the Y-Axis title is formed like this: PCode: Parameter Name (units); if you want it labelled differently, uncheck one or more boxes.
The Build Calibration Tabs & Layouts option works as just described, however for each combination of Aggregate Station and Parameter, three graph tabs will be created: time series, probability, and scatter plot. In addition, a new Named Layout called "Calibration" will be created with four cells per page defined, containing those three graph tabs plus the associated calibration report. See Printing Graphs.