Print the current graph tab by selecting File | Print. The currently selected tab (or all tabs if Apply to All Tabs is selected) will be printed and (by default) will be sized to span the entire page width (obeying the printer's landscape/portrait settings). Note that the aspect ratio (width/height) of the graph window will be used to determine the shape of the printed graph.
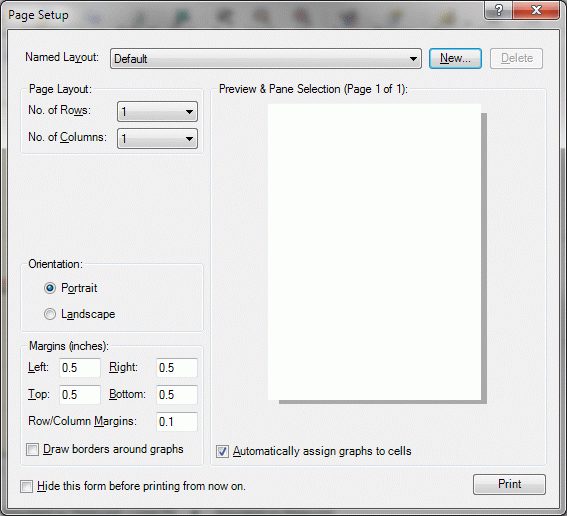
Before printing (or any time by selecting File | Page Setup...) the Page Setup form will appear which can be used to define complex named page layout templates which control how your printed graphs will look:

This is the default layout (which can be reconfigured but never deleted) that basically indicates that a single graph tab will be printed on a single sheet of paper utilizing the specified orientation and margins. You can modify this default layout or add additional named layouts that allow you to print multiple graphs per page for specific graph tabs or all graph tabs (again, if Apply to All Tabs is selected).
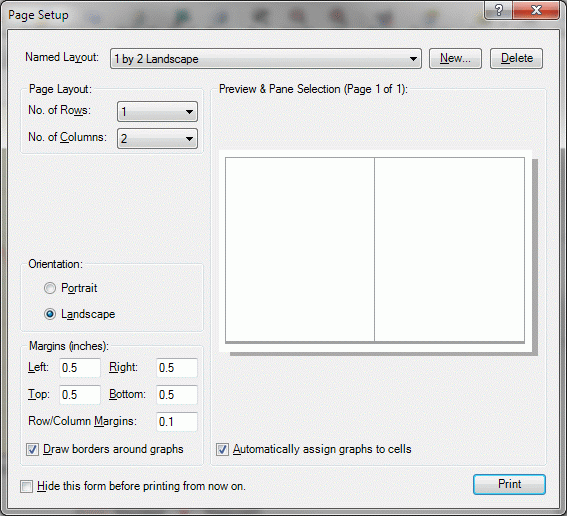
Consider the following:

A new named layout was created by clicking the New... button and entering the indicated name, then the settings were configured as shown. Because Automatically assign graphs to cells is checked, each cell on the page is filled with the contents of a graph tab. If Apply to All Tabs is not selected, then only the currently selected graph tab will print (in the left cell); otherwise all graph tabs are printed, in order, filling the available cells until all tabs have printed. For example, if you have six graph tabs, then three pages will be printed (two graphs per page).
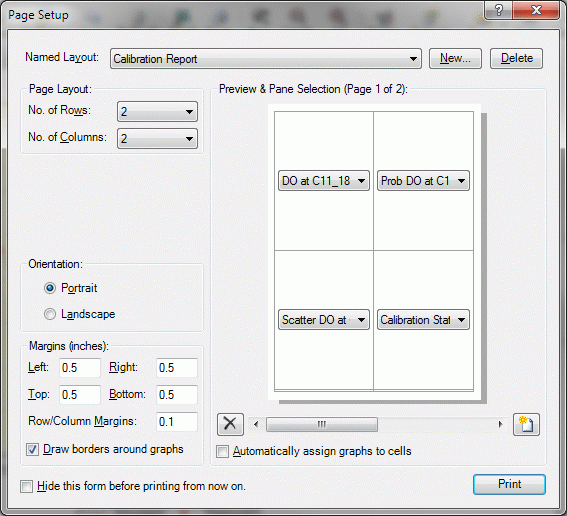
You may wish to have more control over what is printed; just uncheck Automatically assign graphs to cells and the form changes to look like this:

Here we have created yet another named layout (Calibration Report) and indicated that we want four graphs per page. Instead of just automatically filling the cells with graph tab contents, here we can create multiple pages in the layout and explicitly assign graph tabs to each cell on each page (by selecting from the drop-down lists). This has the added benefit of allowing use to select a calibration report as the contents of one or more cells or leaving one of the cells empty.
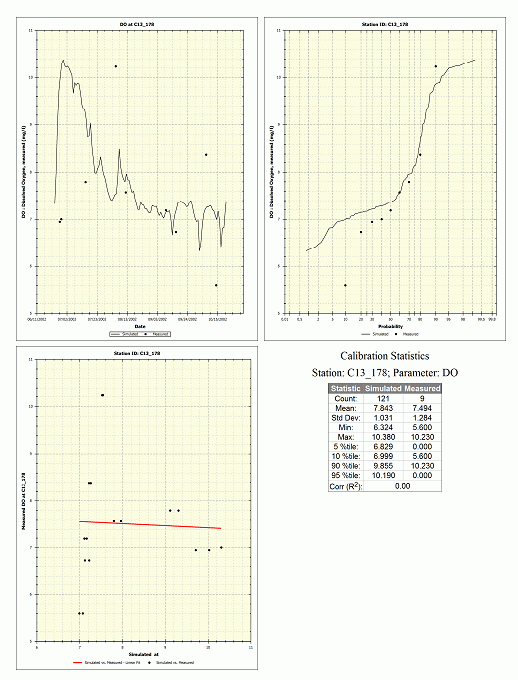
One of the pages of this report layout looks something like this:

As you can imaging, it can be somewhat time consuming to manually define multi-page layouts if you have dozens of calibration graph tabs comparing measured and simulated data at several stations for several parameters. When you use Tools | Build Graphs | Calibration Tabs & Layouts not only are tabs automatically added, but page layouts are created with a predefined set of graph types.