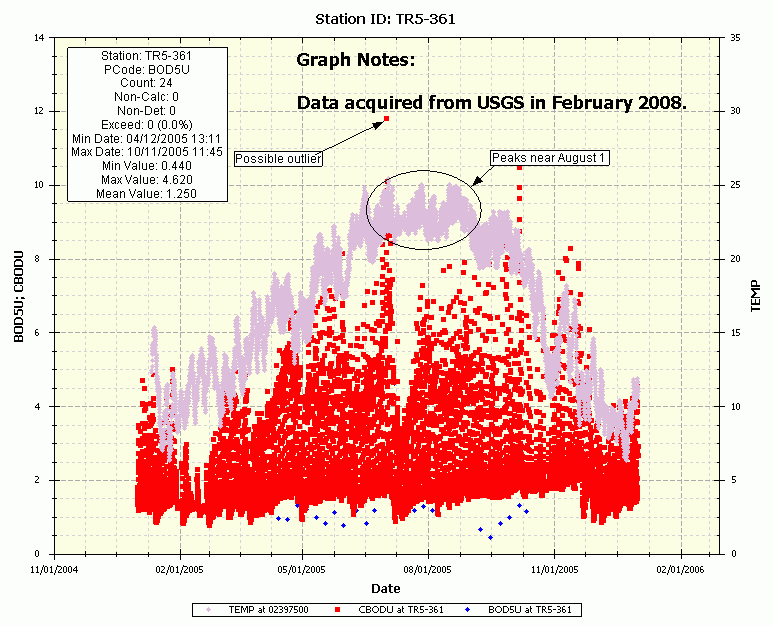
WRDB Graph provides some limited capability to annotate your graphs. Although the features are nearly as capable as those in, say, Excel, they should be adequate for many uses.
In addition to the graph title that can be set automatically or manually, WRDB Graph lets you add Graph Notes. This is an arbitrary length text that is positioned in one of six possible locations on the graph. You can choose to set the font, text alignment, and border/background visibility as well. To enter multi-line text, click the down arrow in the properties grid and use the Enter key to add more lines.
Each data series has statistics computed for it. They can be displayed on the graph in much the same way as graph notes. Statistics are created when the series is first added; if you change the statistics text to be displayed in the text box, you will need to remove then re-add the series to restore the original text.
You can draw some simple shapes on your graph (arrow, line, ellipse, box, text) using colors you choose. The shapes are anchored to the graph surface, not the data, so if you zoom or pan the shapes may not appear where you want.
You also have the option of hiding, showing, and erasing all shapes and annotations. Note that WRDB Graph does not support the selection, resizing, and movement of shapes that have been previously created like more powerful graphing packages. Should those features be needed, just copy the graph to the clipboard and annotate them with a more advanced program like Paint, Work or Excel.
An example of an annotated graph:
