The WRDB Download Data tool can be used to acquire water quality and quantity data from a variety of public sources and import them to your active Working table. To do this, open a Working table and then select Edit | Import | Download Data to see this form:

This form and Setup tab have the following components:
Map: a web-based map is displayed in the main part of the form. Several different map types can be selected from the Map Type drop-down list including, ArcGIS, Bing, Google, Yahoo, etc. Navigate the map as follows:
Zoom in and out using the vertical trackbar in the upper-left corner or by rolling the mouse wheel
Zoom to a window by pressing the Shift key and dragging a window while pressing the left mouse button (click anywhere on the map to clear the blue zoom window)
Pan by clicking the arrows above the vertical trackbar or by pressing the mouse wheel while moving the mouse
Right-click on the map to view the context menu (the first three items only apply after you've selected your Area of Interest and Data Source:
Select All Stations: all available stations in your Area of Interest are selected
Select No Stations: all available stations in your Area of Interest are deselected
Zoom to Area of Interest: the map is repositioned to give the best display of your previsously selected Area of Interest
Find Location: you will be prompted to enter a place name (name of city, lake, street, creek, etc.); the map will be recentered on this location (you can zoom in closer for a better look)
Select the Area of Interest by holding the Control key and dragging the window while pressing the left mouse button (alternate to clicking the Set Area of Interest button)
Hover your mouse over a station symbol to see the ID and name
Click on a station symbol to select/deselect it (when deselected, the symbol appears to have an "X" through it)
Data Source: WRDB is able to acquire data from a number of public domain web data sources which allow you to select Stations and Parameters. You can filter the stations and parameter lists by entering parts of teh desired names in the textbox below the list and pressing the Enter key. These data sources are typically under development and may be subject to change or outage at any time. At the time of this writing, the following data sources are available:
USEPA STORET: contains water quality data for the entire U.S. You cannot select specific parameters; instead select from a set of five standard parameter types.
USGS NWIS Water Quality, Daily Values, and Real-time Instantaneous: this provides water quantity and quality and meteorologic data for the entire U.S. The list of parameters does not depend on the selected stations (there is no way to query available parameters for a station).
NOAA NCDC: the National Climatic Data Center distributes data collected by NOAA and the National Weather Service. When selected, an additional tab appears: Location & Dataset. Because the NCDC is unable to initially select stations by Latitude/Longitude, you must select the country and/or U.S. state before the stations can be displayed. You must also select one of the three available datasets: Daily, Integrated Surface Hourly (ISH) and Integrated Surface Daily (ISD), each of which has its own set of stations and parameters. The list of parameters does not depend on the selected stations (there is no way to query available parameters for a station). This service is really new and a bit rough.
CUAHSI HIS Central: the Consortium of Universities for the Advancement of Hydrologic Science, Inc. Hydrologic Information Service is a clearinghouse for many public water resources data providers, including those listed above (referred to as networks). CUAHSI provides a common ontology for parameters adapted to each provider (although problems with their parameter mapping scheme prevented use of this unique feature in WRDB). When this data source is selected, two additional tabs appear: Networks and Series. You can select one or more networks, and the list of available parameters depends on the stations you have selected. You can further identify what time series you are interested in (combinations of stations and parameters). Note that the series data count and available time spans are not frequently updated: if you select data from 1/1/2010 to 1/1/2011, no series may appear, however if you change the query to 1/1/2009 to 1/1/2011, many series will appear, and you will be able to download data through 1/1/2011 as requested.
Set Area of Interest: after zooming and panning to get near the desired area, click this button and then drag a window on the map to identify your desired area of interest (shown as a dashed red line). Only stations within that area will be displayed.
Date Range: use these controls to set the starting and ending date for which you want data. Most (but not all) data sources will display only those stations that have data within the specified date range.
Information Panel: this shows how many stations and parameters have been selected. For some providers, the estimated count of observations is also displayed.
After you have identified all stations and parameters of interest (and for CUAHSI, time series), clicking the Import button will acquire all requested data that can be found and temporarily store it in memory. For all datasources other than CUAHSI, it may actually be faster to select all parameters than some of them: in the first case, a separate query must be performed for each parameter; in the latter a single query is run for all parameters.
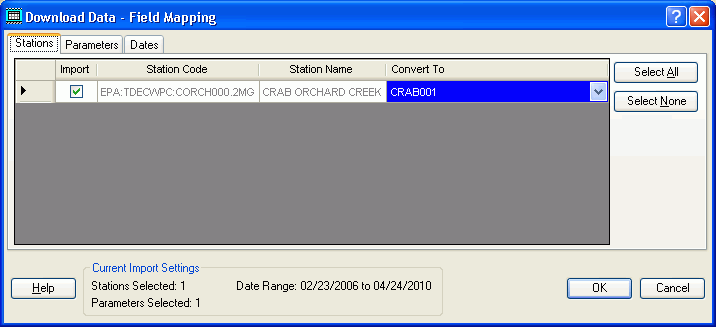
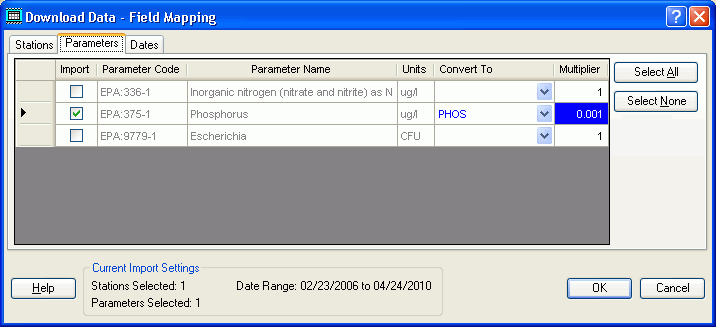
After all initially requested stations and parameters area acquired, the Download Data - Field Mapping form appears. This shows you the stations and parameters that were actually downloaded (remember, not all parameters are actually available for all selected stations). Using this form, you make a final selection of what stations and parameters you want to import, and select existing (or create new) Station IDs and PCodes to which the data will be assigned. The Mapping form has three tabs:

If you check the Import box on a line before assigning a Station ID or PCode, a new code will automatically be created based on the station or parameter name. You can of course reselect the code if you choose. Any new codes that are created are automatically imported to the appropriate Support table.

Because data for some parameters are stored using units different than those in your WRDB project, you can also specify a multiplier that will be used upon import. In the above example, data stored in ug/L will be converted to mg/L by multiplying each phosphorus data point by 0.001.

If you also want to further restrict the range of dates to be imported, you can do that on the Dates tab. You cannot expand the date range.
When you click OK, the data will be processed and you will be given a final chance to confirm the date to be imported to your Working table:

If you click OK, the records will be imported to the Working table as well as the Stations, Parameters, and other Support tables.