This GIS menu item is available only when WRDB is being used as a BASINS plugin.
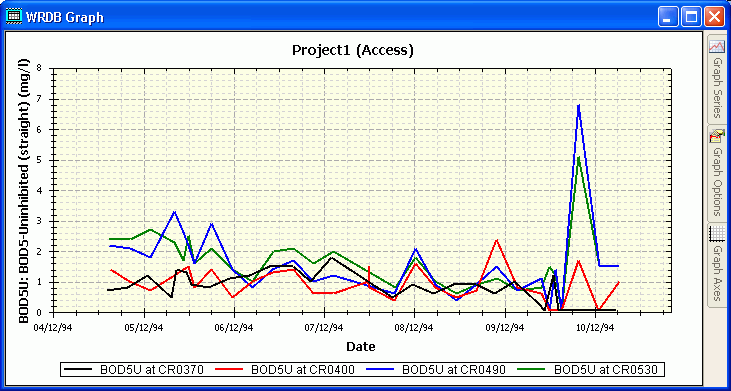
When activated, a time series graph form is opened and graph series are added for each selected station:

As you select other stations and re-select this menu item, the first graph form is updated to show the data from the newly selected stations.