The graphing tool developed for WRDB goes far beyond the typical graphing
applications in that it is tightly integrated into WRDB and provides many
advanced features for performing data analyses. In addition to displaying
selected data from WRDB tables, may other types of data files can be graphed
including BMD, Paradox, dBase, Excel, text, DSS, WDM, HSPF, GSSHA, LSPC,
database files such as Access, Firebird, SQLite, and SQL Server CE, and
external database connections to Oracle, SQLServer,
Firebird, and MySQL.
WRDB Graph can do data aggregation, smoothing, calculated series,
criteria limits, and calculations between series (adding and subtracting).
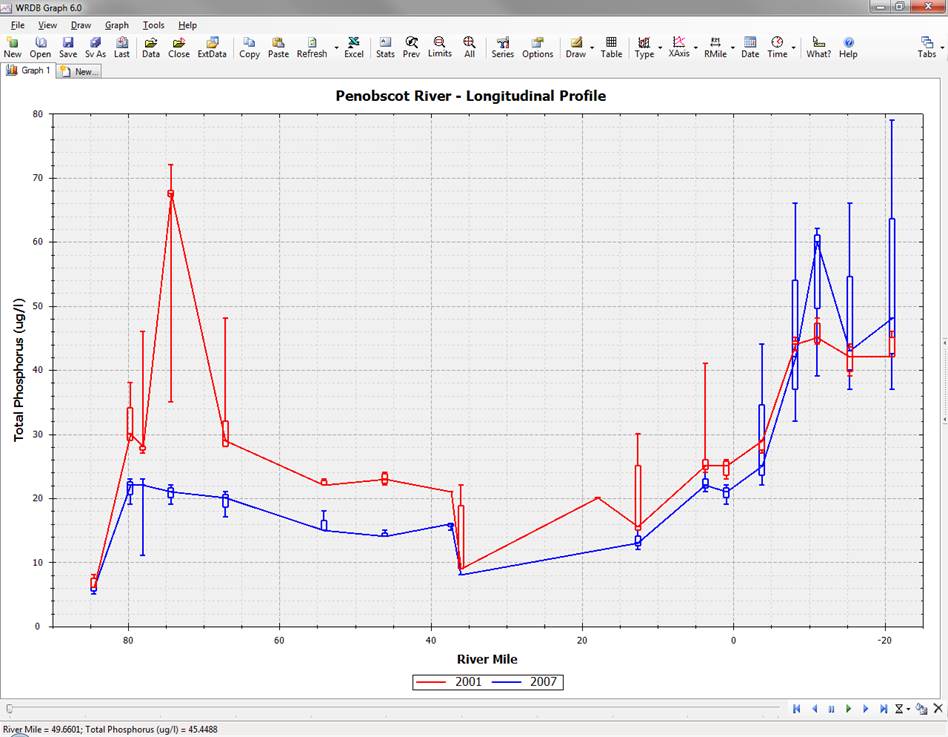
Calibration datasets can be created to quickly compare observed and computed data
using one of several graphical formats: time series, longitudinal, depth, and
width profiles, scatter plots, histograms, probability, and load-duration. In
many cases time-varying data can be animated and movies recorded. Regression
lines and probability distributions can be fitted to selected data series.
The graphing tool is so robust that it has been adopted as the standard postprocessing tool used by WASP, EPDRiv1, and EFDC and can
be used for model visualization for many other types of water resources and
water quality models.